The map will be used to pinpoint the water quality tests that are performed during the Forest & Rail Project. Google Maps is an excellent application for students to use when collecting field data.
View Water Quality Testing in a larger map
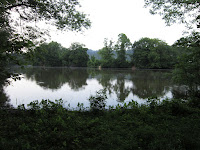
Procedure: This lab was performed inside where it was easier collect data. For accurate results I would need to test from the backwater directly. There 5 tests performed and on three of the tests I collected temperature. The temperature was decreasing due to the fact it was removed from the habitat. The data was collected from the backwater of the Kanawha River in Winfield, WV from 6:00pm to 7:30pm. Click here for the reference site used in comparing data to water quality parameters.
Dropbox Link: Winfield WV Kanawha River Backwater 052812
- Test #1
- Dissolved Oxygen
- The median for the dissolved oxygen was 7.33 mg/L. According to the reference website this is optimal for many aquatic animals.
- Temperature
- The median for the temperature was 27.62 C°. Temperature is dependent upon the type of organism(s) that live within the habitat. Maximum and Optimal temperature are used to determine an organisms temperature range. Maximum temperature is the highest water temperature the organism can live within a few hours. Optimal temperature is where the organism thrives to be able to spawn a new offspring.
- Test #2
- pH
- Median: 7.63. The majority of freshwater organisms live within a pH range of 6.5 to 8.0. From this data the organisms that live in the backwater are within an optimal pH range.
- Temperature
- Median: 27.02 C°.
- Test #3
- Conductivity
- Median: 114.54 µS/cm. This test indicates the amount of dissolved electrolytes within the body water. It may not indicate the type of electrolytes, but it can indicate an increase of electrolytes; which can be inferred to be excess nitrate, phosphate, and sodium from fertilizer or other products with similar ingredients. The optimal range for conductivity for a flowing stream should be around 150 to 500 µS/cm. From this data the conductivity is low, but it's still within range for organisms to live.
- Temperature
- Median: 26.51 C°.
- Test #4
- Turbidity
- Median: 19.67 NTU. This is a measure of how cloudy the water is. The more particulates that are in the water from erosion or life processes from organisms the it is for aquatic producers to perform photosynthesis. From this measurement the backwater is relatively clear.
- Test #5
- GPS
- Longitude: -81.86633°
- Latitude: 38.52648°
- Altitude: 183
Water monitoring is a routine procedure for rivers that came in direct human contact for swimming, water use purposes. A standard bacteria level detection process align for rivers water quality testing.
ReplyDeleteGroundwater Testing